Mortgage And Real Estate News

Wednesday, July 21, 2021

Volatility Settles Down but Monday's Selling Still Sets the Pace


Published Date 7/21/2021

Stock indexes early this morning were mixed, the DJIA +141 at 8:30 am ET while NASADAQ -17. The 10 yr. note began up 2 bps to 1.23%, MBS prices -2 bps from yesterday. Starting the day with less volatility, no key data today; Treasury will auction $24B of 20 yr. bonds at 1:00 pm ET.

Traders turning to earnings season as would be normal but recent volatile movement put earnings on the back shelf for the last few sessions. Johnson & Johnson, Coca-Cola Co., Verizon Communications Inc., Kinder Morgan Inc., Baker Hughes Co. and Harley-Davidson Inc. among the many, many companies reporting.

Today is the day Congress was supposed to vote on the infrastructure bill, a $1T package that will fail as bipartisan negotiations drag on. Majority Leader Chuck Schumer has set a vote for today to begin consideration of infrastructure legislation, a step that Republicans have said they would oppose absent more details on its contents and how it would be paid for. Schumer is also pushing for all 50 members of the Democratic caucus to agree to a $3.5T outline for a broad antipoverty and climate package they are pursuing in parallel to the bipartisan infrastructure talks. Democrats on the Budget Committee and Mr. Schumer had announced a deal on the budget framework last week. The $3.5T bill tied to the infrastructure bill isn't likely to get enough votes.

Mortgage applications last week declined; the composite index -4.0%, purchase apps -6.4% while re-finances were down 2.8%. It's a week old news, with this week's drop in mortgage rates we look for a dramatic increase in re-finances and purchases a week from now. Not news that purchases are slow with increasing home prices and a lack of inventories countrywide. Purchase applications the lowest since May 2020. The average contract interest rate for traditional 30-year mortgages increased to 3.11% from 3.09% the prior week; already this week 30 yr. mortgages at about 2.85%.

The Treasury debt limit is presently $28.5B, it can't exceed that level. It isn't the first time and won't be the last that that government spending will exceed the statutory limit. I has to be increased or the government will shut down, and that is not likely. Worst case, a day or two shutdown before the debt limit is increased; there have been three instances of a short shutdown over the last 10 years. On July 31, the Treasury Department technically bumps up against its statutory debt limit. Today the Congressional Budget Office is scheduled to release its latest estimate of when the government actually would be unable to pay its bills -- known as the "X Date."

At 9:30 am ET the DJIA opened +175, NASDAQ +11, S&P +9. 10 yr. note at 9:30 am ET 1.27% +6 bps. FNMA 2.0 30 yr. coupon at 9:30 am ET -16 bps from yesterday's close and -44 bps lower than at 9:30 am ET yesterday; the 2.5 coupon at 9:30 am ET -24 bps from 9:30 am ET yesterday.

The interest rate markets now still correcting from the excessive selling on Monday. The 10 yr. note technical support now at its prior resistance at 1.30%, likely to be tested. If 1.30% holds look for a new trading range for the 10 between 1.30% and 1.20%.

Source: TBWS


Tuesday, July 20, 2021

3 Charts That Show This Isn’t a Housing Bubble


3 Charts That Show This Isn't a Housing Bubble | MyKCM

With home prices continuing to deliver double-digit increases, some are concerned we're in a housing bubble like the one in 2006. However, a closer look at the market data indicates this is nothing like 2006 for three major reasons.

1. The housing market isn't driven by risky mortgage loans.

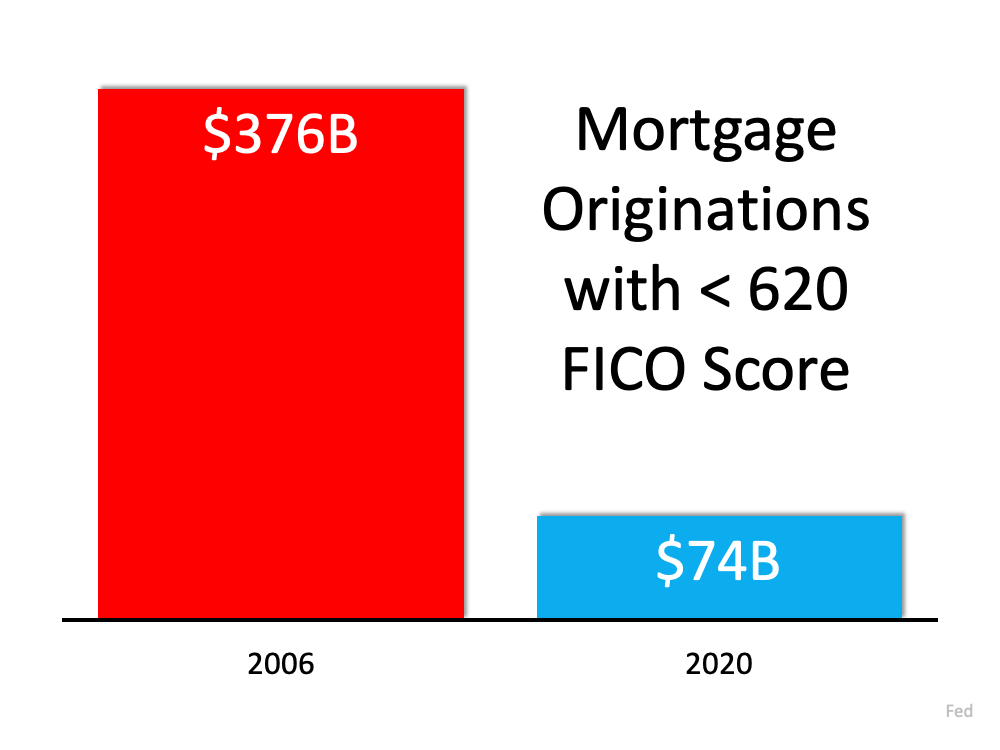
Back in 2006, nearly everyone could qualify for a loan. The Mortgage Credit Availability Index (MCAI) from the Mortgage Bankers' Association is an indicator of the availability of mortgage money. The higher the index, the easier it is to obtain a mortgage. The MCAI more than doubled from 2004 (378) to 2006 (869). Today, the index stands at 130. As an example of the difference between today and 2006, let's look at the volume of mortgages that originated when a buyer had less than a 620 credit score.3 Charts That Show This Isn't a Housing Bubble | MyKCMDr. Frank Nothaft, Chief Economist for CoreLogic, reiterates this point:

"There are marked differences in today's run up in prices compared to 2005, which was a bubble fueled by risky loans and lenient underwriting. Today, loans with high-risk features are absent and mortgage underwriting is prudent."

2. Homeowners aren't using their homes as ATMs this time.

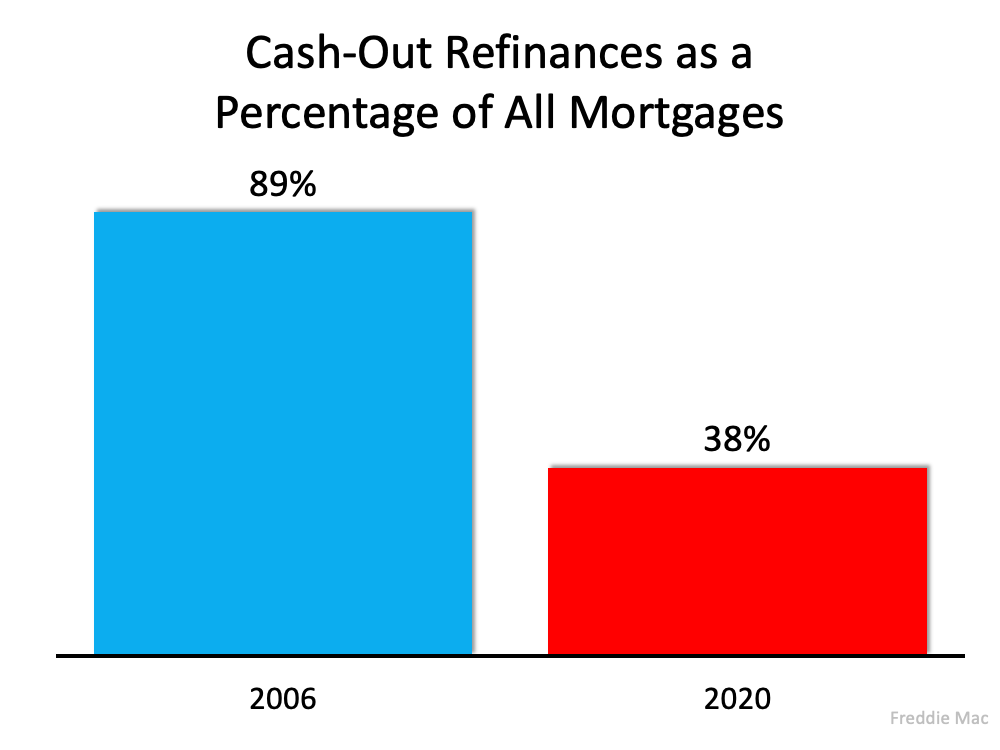
During the housing bubble, as prices skyrocketed, people were refinancing their homes and pulling out large sums of cash. As prices began to fall, that caused many to spiral into a negative equity situation (where their mortgage was higher than the value of the house).

Today, homeowners are letting their equity build. Tappable equity is the amount available for homeowners to access before hitting a maximum 80% combined loan-to-value ratio (thus still leaving them with at least 20% equity). In 2006, that number was $4.6 billion. Today, that number stands at over $8 billion.

Yet, the percentage of cash-out refinances (where the homeowner takes out at least 5% more than their original mortgage amount) is half of what it was in 2006.3 Charts That Show This Isn't a Housing Bubble | MyKCM

3. This time, it's simply a matter of supply and demand.

FOMO (the Fear Of Missing Out) dominated the housing market leading up to the 2006 housing bubble and drove up buyer demand. Back then, housing supply more than kept up as many homeowners put their houses on the market, as evidenced by the over seven months' supply of existing housing inventory available for sale in 2006. Today, that number is barely two months.

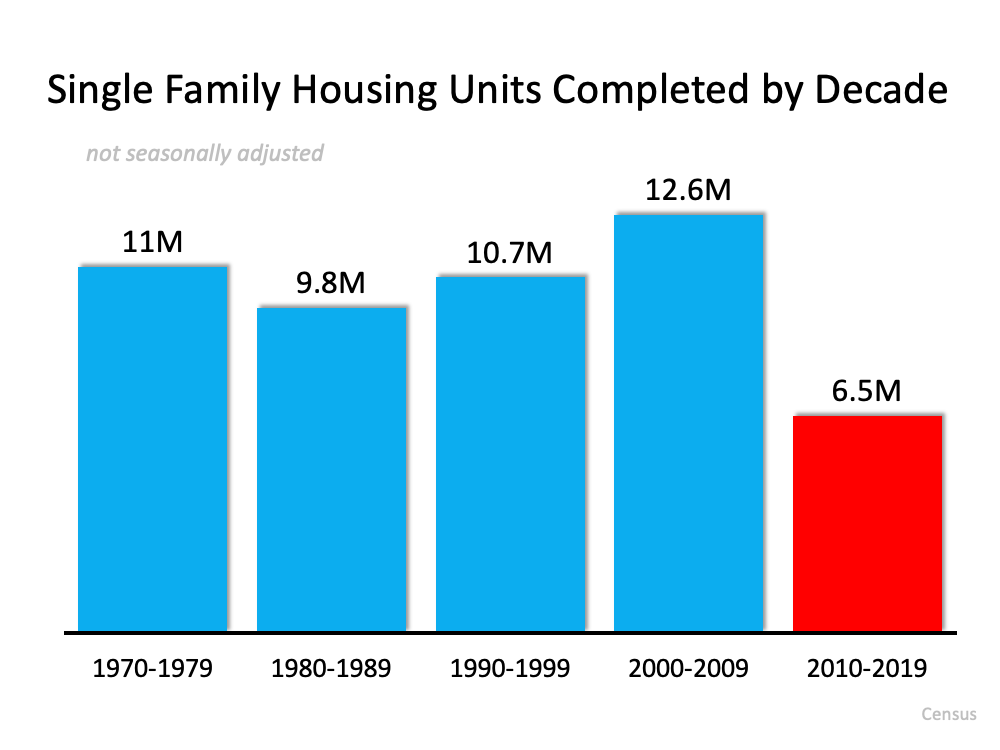
Builders also overbuilt during the bubble but pulled back significantly over the next decade. Sam Khater, VP and Chief Economist, Economic & Housing Research at Freddie Macexplains that pullback is the major factor in the lack of available inventory today:

"The main driver of the housing shortfall has been the long-term decline in the construction of single-family homes."

Here's a chart that quantifies Khater's remarks:3 Charts That Show This Isn't a Housing Bubble | MyKCMToday, there are simply not enough homes to keep up with current demand.

Bottom Line

This market is nothing like the run-up to 2006. Bill McBride, the author of the prestigious Calculated Risk blog, predicted the last housing bubble and crash. This is what he has to say about today's housing market:

"It's not clear at all to me that things are going to slow down significantly in the near future. In 2005, I had a strong sense that the hot market would turn and that, when it turned, things would get very ugly. Today, I don't have that sense at all, because all of the fundamentals are there. Demand will be high for a while because Millennials need houses. Prices will keep rising for a while because inventory is so low."

Rate volatility remains high with housing data in for June


Published Date 7/20/2021


Today's Mortgage Rate Summary

How Rates Move:

Conventional and Government (FHA and VA) lenders set their rates based on the pricing of Mortgage-Backed Securities (MBS) which are traded in real time, all day in the bond market. This means rates or loan fees (mortgage pricing) moves throughout the day, being affected by a variety of economic or political events. When MBS pricing goes up, mortgage rates or pricing generally goes down. When they fall, mortgage pricing goes up.

Rates Currently Trending: Neutral

Rates are moving sideways so far today.  The MBS market improved by +8 bps yesterday. This caused rates or fees to mostly move sideways for the day. The rates experienced high volatility yesterday.

Today's Rate Forecast: Neutral

Housing: June Housing Starts were better than expected (1.643M vs. est. of 1.590M) but Building Permits were lighter than expected (1.598M vs. est. of 1.700M)

Central Banks: The People's Bank of China kept their key interest rate at 3.85%

Today's Potential Rate Volatility: High

This morning we're expecting some bounce back after yesterday but instead we have floated around the resistance level of the trading channel. Volatility remains high with Delta variant and inflation competing for market focus.

Bottom Line:

If you are looking for the risks and benefits of locking your interest rate in today or floating your loan rate, contact your mortgage professional to discuss it with them.

Source: TBWS


Monday, July 19, 2021

Global Markets Are Shaping Rates

Global Markets Are Shaping Rates

Last Friday the 10-year note closed right on its technical resistance at 1.30%. On Friday afternoon we commented "However it happens next week, the 10-yr. note (thus mortgage rates) are likely to see larger movements than we saw this week. Either the 10 breaks below 1.30%, or it doesn't; regardless the direction, the 10- yr. and mortgages are in for a volatile week coming up". The 10 broke the resistance at 8:00 pm ET yesterday and fell through the night and early morning, dropping the note to 1.22% at 8:30 am ET, 8 bps lower than Friday's close. MBS prices at 8:30 am ET +19 bps from Friday's close. The biggest moves in the interest rate markets just began overnight.

US stock indexes are getting slapped hard in pre-opening trade. The DJIA at 8:30 am ET was down -500. The news wires are pointing to the rising COVID delta virus as one key reason for the global equity markets slumping. While this is not happening as much here in the US, Asian countries and Europe are seeing a dramatic increase in new cases. There is more to it, however. This morning in the WSJ key economists from the large Wall Street firms are expecting the strong economic growth that has marked this year won't be sustained in Q3 and Q4. While they aren't looking for any recession and are still quite bullish for this year and in 2022, growth is not expected to be as powerful. "We've moved into the more moderate phase of expansion," said Ellen Zentner, chief U.S. economist at Morgan Stanley. "We're past the peak for growth, but that doesn't mean something more sinister is going on here and that we're poised to then drop off sharply."

It's not news that the economy has been on fire. It's also not news that financial markets have continued to push to new highs almost daily with demand for unproven IPOs, only now being seen in the light of excessive optimism. A correction is getting underway with increasing thoughts of a cooling down of the recent growth in outlooks when seen in the context of present growth outlooks that have softened over the last few weeks. The headlines in the media are that the decline in stocks and interest rates is mostly due to the increase in the spread of the delta variant. It may not be that simple, however.

At 9:30 am ET the DJIA opened down -458, the NASDAQ -171, S&P -51. 10 yr. 1.23% -7 bps. FNMA 2.5 30 yr. coupon +17 bps from Friday's close and +14 bps from 9:30 am ET Friday.

At 10:00 am ET the July NAHB housing market index expected at 82 from 81 in June, as released 80. Still strong but the index has leveled off the last three months.

It is a different world these days in movements of US treasuries and mortgage prices; in the so-called "old days" most of the changes in US interest rates occurred in the US session; these days the majority of the changes begin in the Asian time session. As is the case today the technical break below 1.30% started at 8:00 pm ET last night.

Source: TBWS


Real Estate News

Reuters: Business News

National Commercial Real Estate News From CoStar Group

Latest stock market news from Wall Street - CNNMoney.com

Archive

Recent Comments